Dashboard
Understand how your business is performing

The Dashboard offers information about your account's activities at a glance. It includes a range of real-time charts to help monitor key metrics and business performance.
Time zone & date refresh
The Reach Admin Portal displays all dates in Coordinated Universal Time (UTC) to maintain consistency across the platform. The data is refreshed every day at 3:00 a.m. UTC and includes all data up to the end of the previous date.
The Dashboard has three main sections: the Total Gross Merchandise Value (GMV) section, the Reports Overview section, and the Chargebacks Overview section.
Use dropdown filters adjust your search parameters according to date range, currency, payment method, country, and more.
The Dashboard page currently does not support exporting data. However, you can download search results in CSV format from the Search page. See Using the search tool for instructions.
Your Dashboard populates automatically once Reach begins processing transactions.
If the charts and graphs on the Dashboard view appear blank, there may be no data to display for that visual, or the user does not have permission to access it. Our access logic updates daily. If you still do not see the visual the next day, contact [email protected].
Total Gross Merchandise Value (GMV)
Whether you want to review this week's sales trends or compare your performance from last year, the Total GMV tab provides a summary of your data for a quick understanding of your sales performance.
Review your total sales using simple filtering options that allow you to sort your data by currency and select timeframes for meaningful comparisons.
Understanding the Total GMV tab
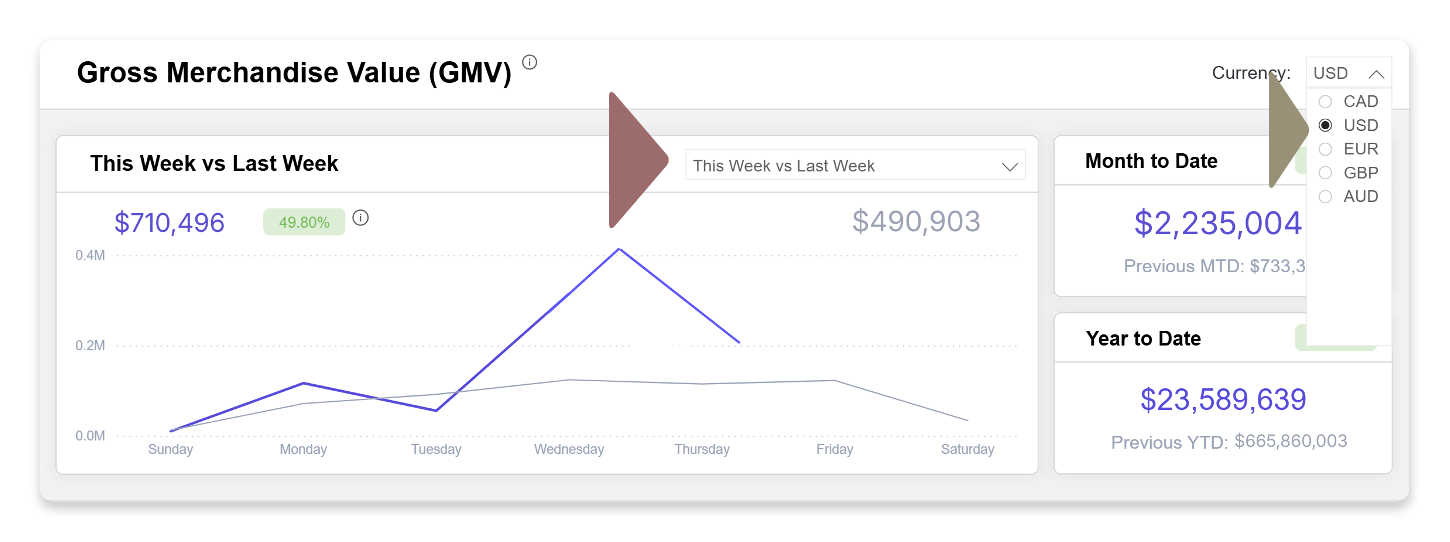
The Total GMV tab has three panes: the GMV line chart, the month-to-date summary, and the year-to-date summary.
Total GMV line chart
This line chart provides a comprehensive view of the total value of goods sold by currency over the current and previous periods. It also displays the percentage difference, providing a comprehensive view of your sales performance.
Month to date summary
This pane shows the GMV for the current and previous month-to-date. It also shows the percentage difference between the previous and current month-to-date.
Year to date summary
This pane compares the GMV for the current and previous year-to-date and shows the percentage difference between them.
Filters in the Total GMV tab
You can filter the chart by currency and time period, allowing you to view the data that is most relevant to you.
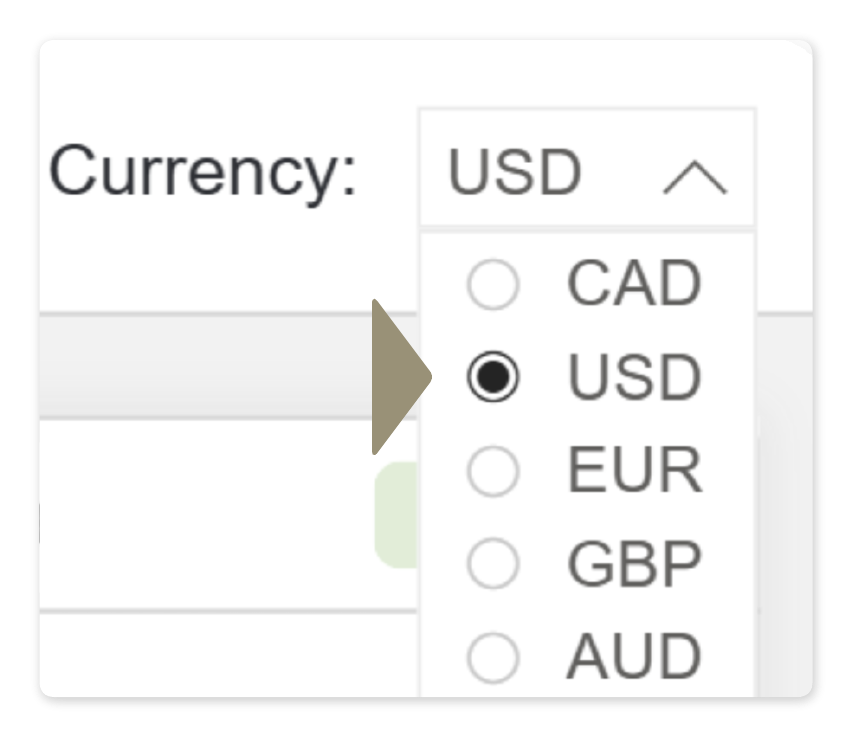
Currency
To filter the Total GMV for a given period by currency, open the Currency dropdown filter on the Dashboards' Total GMV tab and select your desired currency.
The dropdown menu only displays the currencies your store supports.
When you change currency, the Difference Percent value may change as it is specific to the daily FX rate on the day of each transaction, which leads to variances in percentage differences.
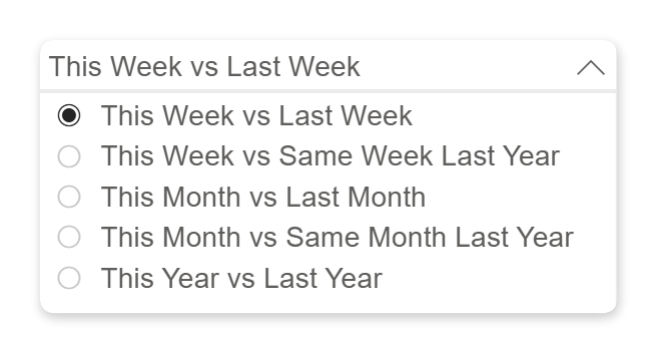
Time period
Select the periods you wish to compare from the time comparison dropdown filter. When you select a period, Reach will compare the latest period with the previous one.
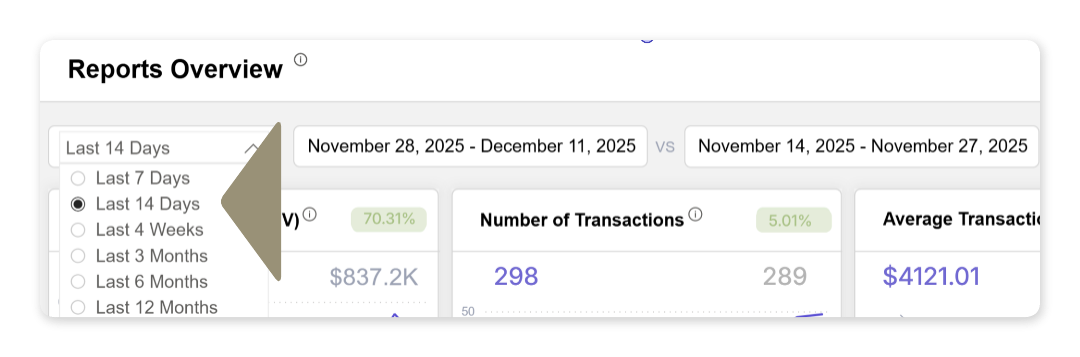
Reports Overview
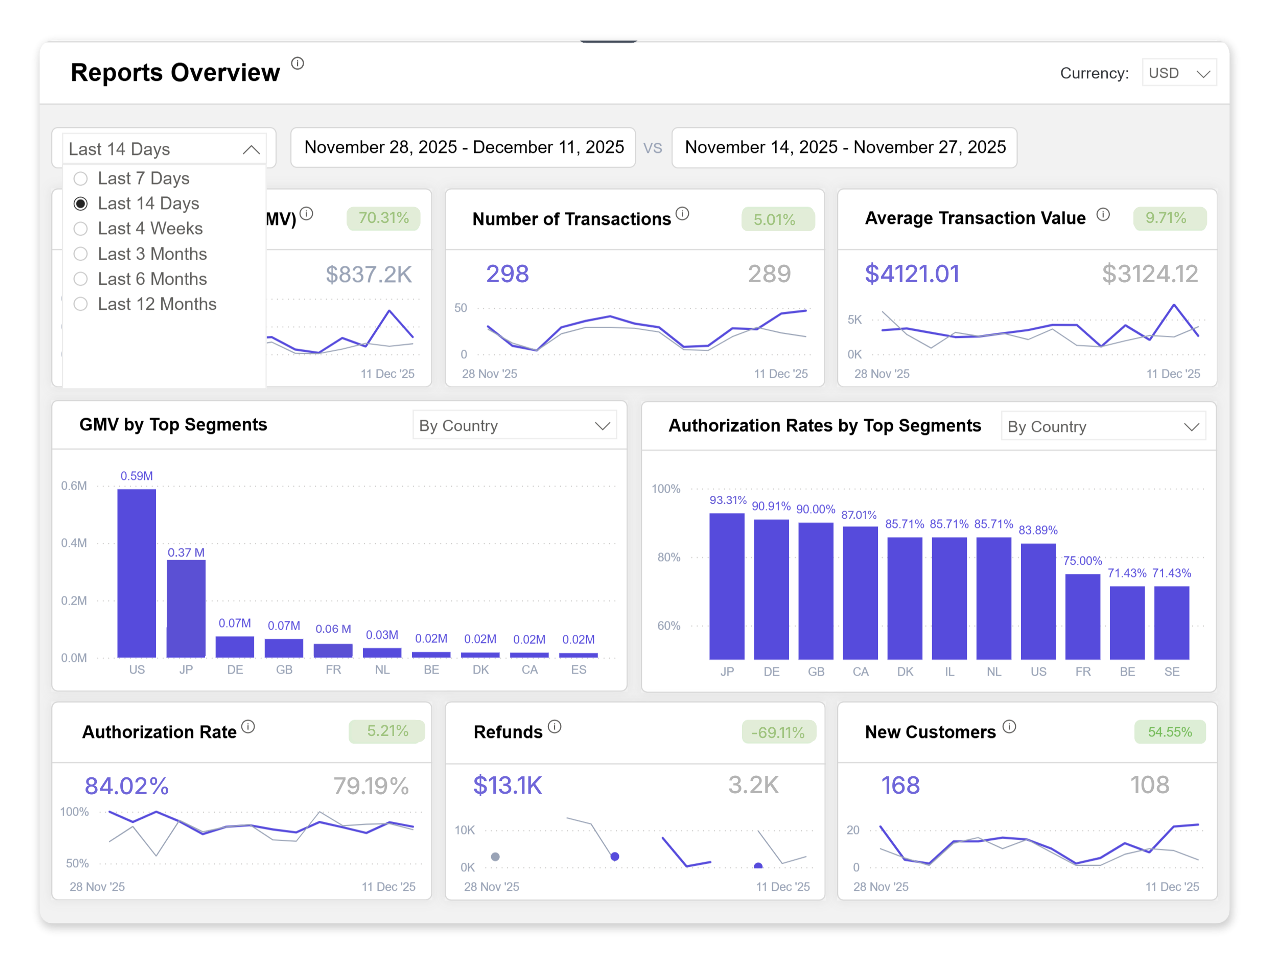
The Reports Overview tab provides a comprehensive view of your business health. Use this sales data to identify trends, monitor growth, and optimize your strategy. The dashboard visualizes essential KPIs, including transaction volume, count, and average value.
You can filter by currency and specific timeframes to drill down into the metrics that matter most to your business.
Understanding the Reports Overview tab
To learn more about each pane in the Reports Overview tab, click the sections below.
Transaction Volume (GMV)
This chart shows the total value of all goods or services sold based on the selected currency and comparison period for all completed transactions. It also shows the percentage difference between the previous and current periods.
Number of transactions
This chart shows the total number of sales transactions for all completed transactions based on the selected currency and the comparison period. It also displays the percentage difference between the previous and current periods.
Average transaction value
This chart shows the average transaction value for all completed transactions based on the selected currency and comparison period. It also shows the percentage difference between the previous and current periods.
GMV by top segments
This chart shows the total value of all goods or services sold by country or payment method. This breakdown can provide valuable insights into which countries or payment methods drive the most sales, helping you make informed business decisions. It also includes the gain/loss percentage over the last period.
Authorization rates by top segments
The Authorization Rates by Top Segments chart shows the authorization rate percentage by country or by payment method.
Authorization rate
The authorization rate indicates the success of authorized transactions. Reach calculates the percentage by dividing the number of successfully authorized transactions by the total number of authorized and not-authorized transactions. The formula for this calculation is: ( total authorized / ( total authorized + not authorized) )
This chart shows the authorization rate percentage by selected currency and comparison periods. It also shows the percentage difference between the previous and current periods.
Refunds
The Refunds chart shows all processed refunds by selected currency and comparison periods. All refund amounts are converted to the chosen currency in the dropdown filter using the daily FX rates on the refund date.
The Refunds chart also shows the percentage difference between the previous and current periods. When the percentage difference shows a negative percentage with a green background, that indicates there was a decrease in refunds, and it is considered a positive metric.
New customers
The New Customers chart shows all new customers who have completed a transaction. When a new customer completes a transaction with a supplier for the first time, Reach identifies them by their unique email addresses. This metric is important as it helps you track the growth of your customer base, which is crucial for business expansion. It also shows the percentage difference between the previous and current periods.
Filters in the Reports Overview tab
Currency
Select a currency from the Currency dropdown filter on the Dashboard's Reports Overview tab. This list only displays the currencies supported for your store.
When you change currency, the Difference Percent value may change as it is specific to the daily FX rate on the day of each transaction, which leads to variances in percentage differences.
Time period
Select the periods you want to compare from the time comparison dropdown filter. When you select a period, Reach will compare the latest period with the previous one.
Country or payment method
You can filter the GMV by Top Segments and Authorization Rates by Top Segments panes using the By Country or By Payment Method options.
Chargeback Overview
Reach calculates the chargeback-to-transaction ratio by dividing the total chargeback volume by the total authorized transaction volume. For this calculation, the chargeback date and transaction start date are in the same period.
( total chargebacks) / (total authorized transactions)Chargeback-to-transaction ratios are evaluated based on the payment method and card scheme (Visa, Mastercard, PayPal, etc.). Generally, a chargeback-to-transaction ratio by count below 0.50% is acceptable. A chargeback-to-transaction ratio by count at or above 0.75% is high. The acceptable thresholds for chargeback-to-transaction ratios are subject to change based on requirements from card schemes and payment methods.
All chargeback amounts are converted to the chosen currency in the Currency dropdown filter using the daily FX rates on the date of each chargeback.
Reach has a dedicated team to handle chargebacks and payment disputes. Whether you wish to accept or challenge a chargeback, Reach can assist you. See the Reach chargeback and disputes guide for more information.
Understanding the Chargeback Overview tab
To learn more about each pane in the Chargeback Overview tab, click the sections below.
Chargeback to transaction ratio panes
By Count:
The chargeback-to-transaction ratio is the proportion of chargebacks relative to authorized transactions. The pane shows the chargeback-to-transaction ratio by count. It also shows the percentage difference between the previous and current periods.
By Sell Amount (Converted):
This pane shows the chargeback-to-transaction ratio by sell amount (converted). It also shows the percentage difference between the previous and current periods.
Chargeback by transaction ratio by top payment methods
This bar chart shows the chargeback-to-transaction ratio by top payment methods. It displays the chargeback to transactoin ratio
Chargeback to transaction ratio by top countries
This bar chart shows the chargeback-to-transaction ratio by top countries. It uses the country codes from the International Organization for Standardization (ISO 3166).
Top chargeback causes
This bar chart displays the number of chargebacks by description or reason. Use the dropdown menu to filter by Chargeback Description or Chargeback Reason. For an in-depth explanation of chargeback causes, review the Reach chargeback and disputes guide.
Chargeback volume by resolution
The Chargeback Volume by Resolution bar chart displays the number of chargebacks won and lost.
Total pending
The Total Pending pane shows the number of chargebacks pending under Count. Any unresolved chargebacks opened at any date in the last two years are included under Count. It also displays the dollar amount converted.
Filters in the Chargebacks Overview tab
You can filter the Chargebacks Overview by volume, currency, and time periods.
Volume type
Select the volume type from the Volume dropdown filter on the Dashboard's Chargeback Overview tab. Your options are By Count and By Amount (Converted).

Currency
Select a currency from the Currency dropdown on the Dashboards' Chargebacks Overview tab. This list only displays the currencies supported for your store.
When you change currency, the Difference Percent value may change as it is specific to the daily FX rate on the day of each transaction, which leads to variances in percentage differences.

Time period
Select the periods you want to compare from the time comparison dropdown filter. When you select a period, Reach will compare the latest period with the previous one. Your options are:
- This Month
- Last 3 Months
- Last 6 Months
- Last 12 Months

Rapid Dispute Resolution
From the RDR dropdown filter, you can choose to include or exclude RDR.
Your options are Exclude RDR or Include RDR. Rapid Dispute Resolution (RDR) automatically resolves certain disputed transactions by issuing a refund before a chargeback is filed. For more information on RDR, contact your Account Manager or [email protected].

Chargeback type
In the Chargeback to Transaction Ratio By Top Payment Methods, you can filter transactions by selecting either Chargeback Description or Chargeback Reason from the dropdown menu.
If you have questions about these metrics, contact [email protected].
Updated 2 months ago